
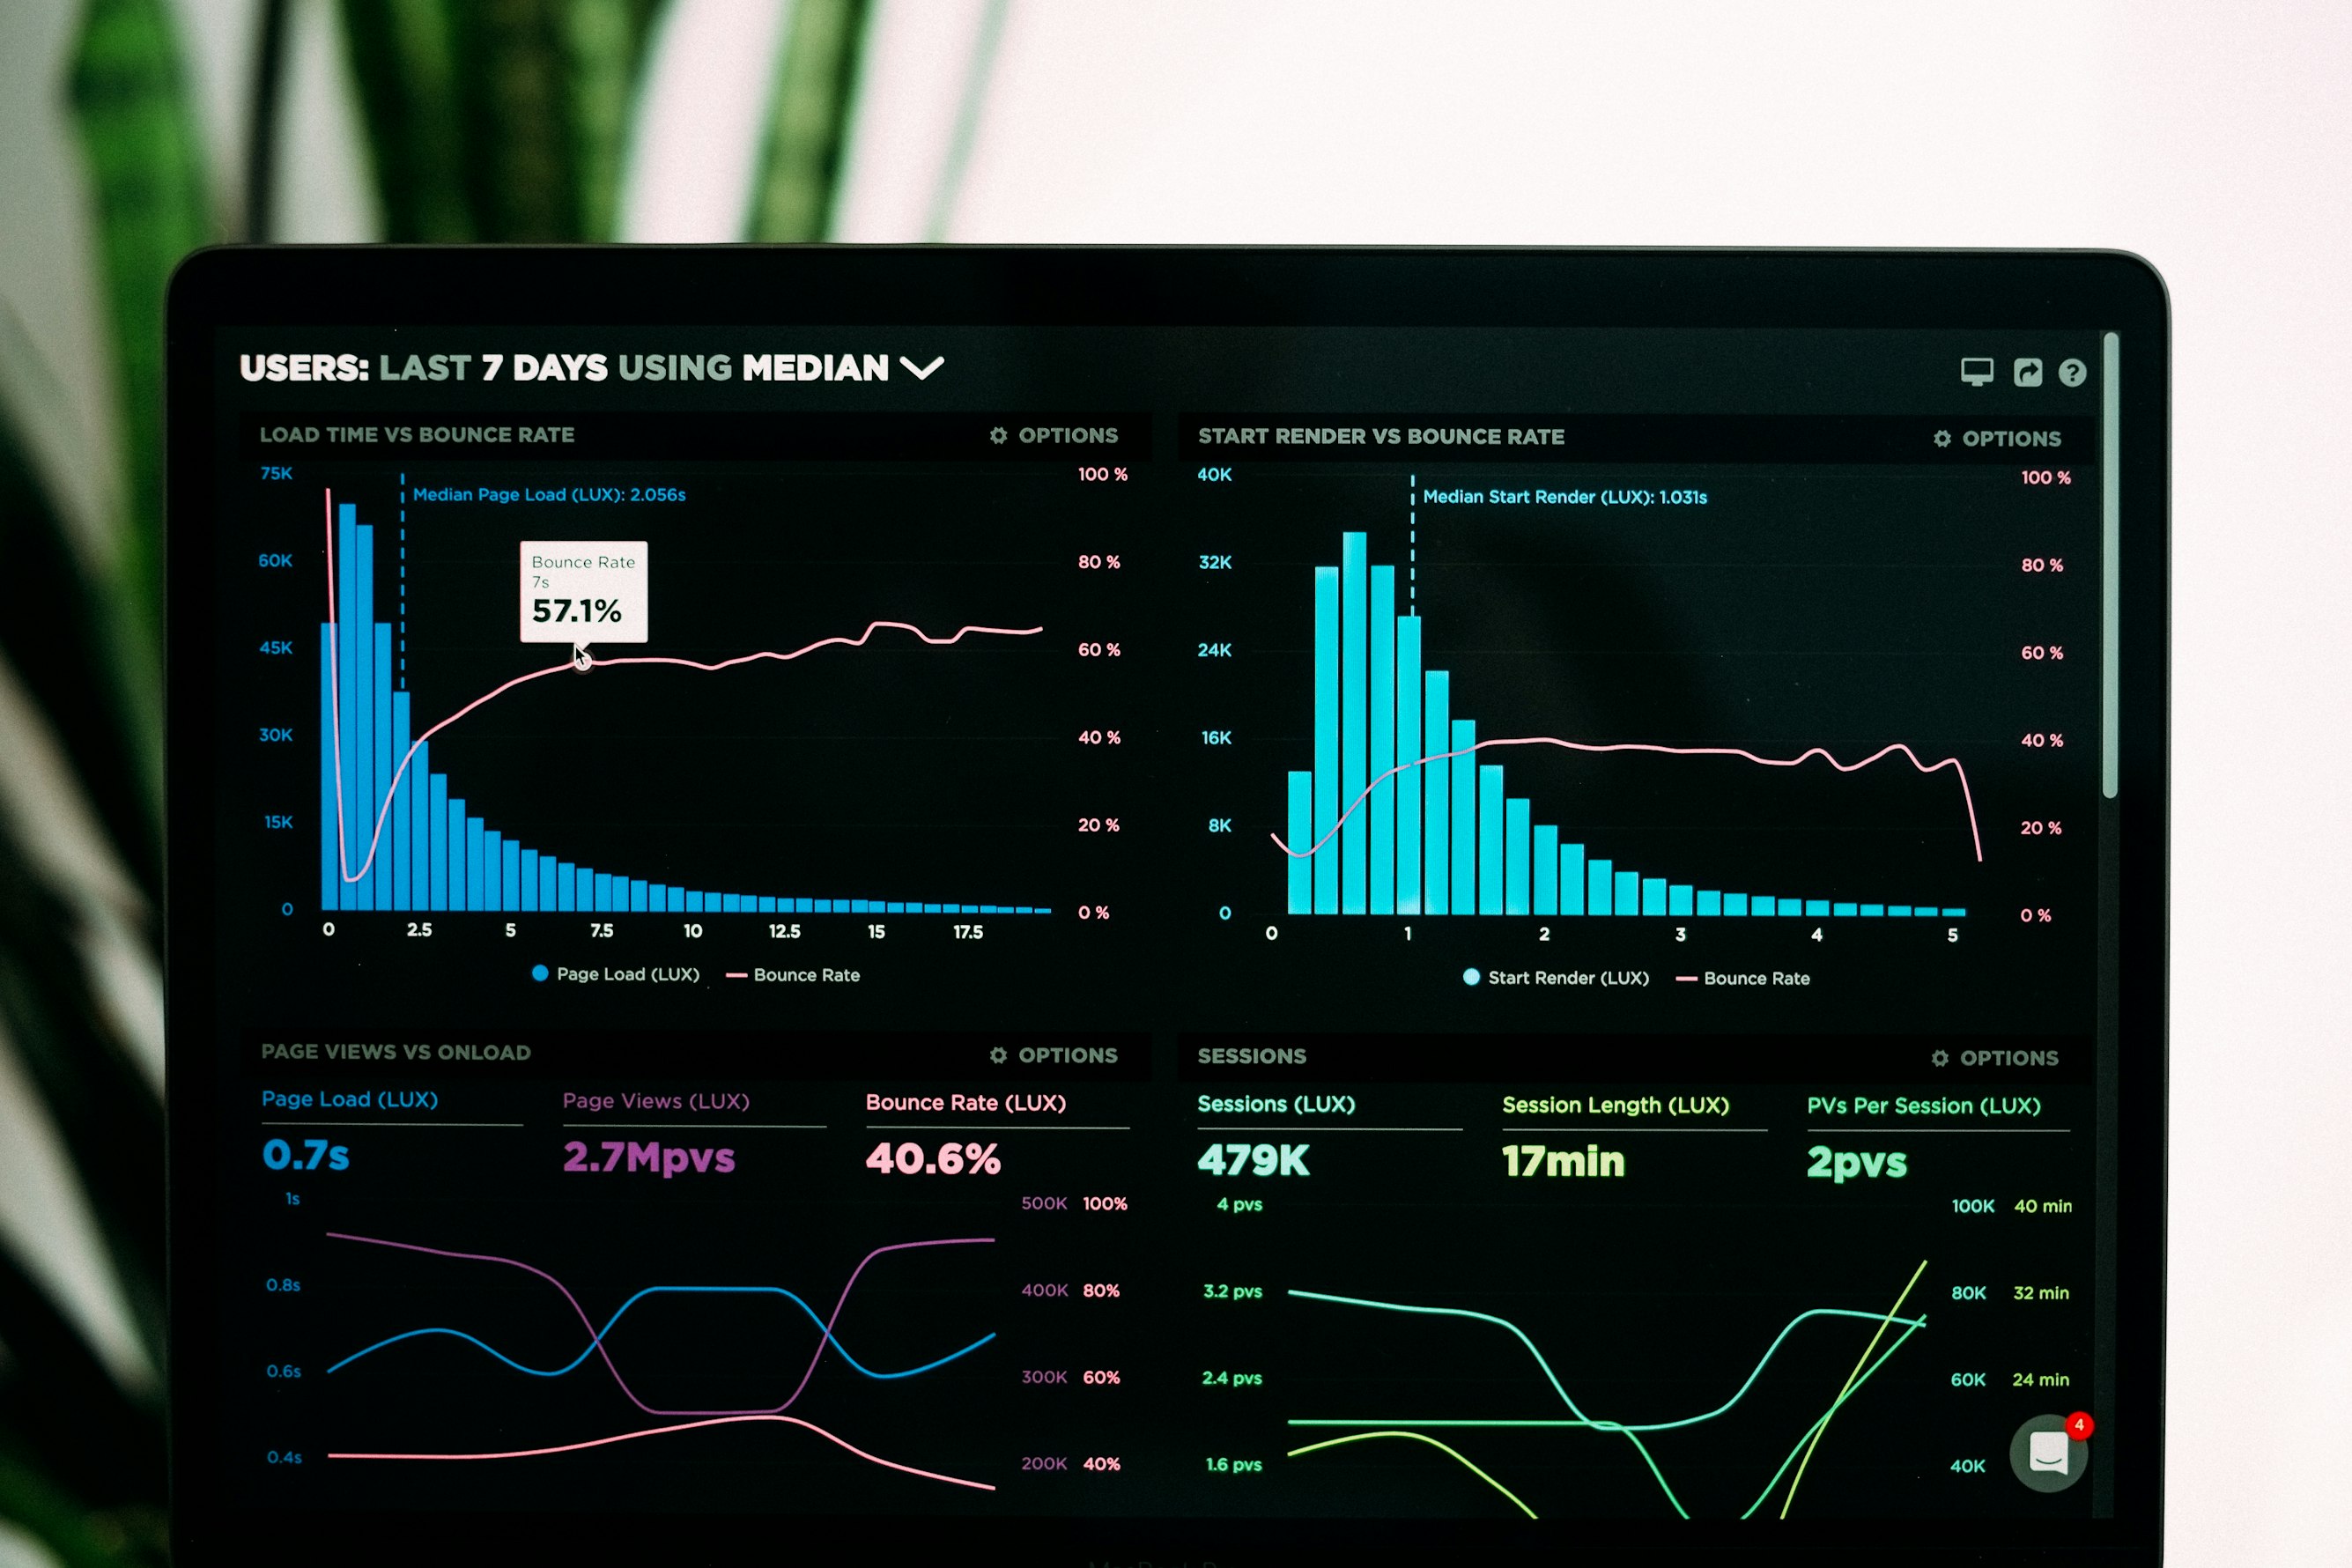
Data and Dashboards
Dashboards and reports that pull together sales, stock, collections and costs, so decisions rest on today's numbers rather than last month's guesswork.
In short
Most businesses already collect plenty of data. It just sits in different places: the billing software, a few spreadsheets, the payment gateway and someone's notebook. We bring it together, clean it up and build dashboards and reports that answer the questions you ask every week. Which products sell? Who owes money? Where do costs go? We start with a handful of numbers that matter and add more only when they're used.
Process
How the work runs, step by step
- 01
Ask which decisions you make every week and what numbers would help
- 02
Find where that data lives today and how reliable it is
- 03
Connect the sources and clean the data automatically
- 04
Build a first dashboard around a handful of key numbers
- 05
Check the numbers with the people who know them best
- 06
Add reports, alerts and forecasts as they prove useful
What you can expect
Why Univolute
- 01
We start from your decisions, not from charts for their own sake
- 02
Numbers are reconciled against your books, so people trust them
- 03
Dashboards built for the phone as well as the office screen
- 04
Reports in your language and format, ready to share or file
- 05
You own the data, the pipelines and the dashboards
Run & Grow
Often paired with

Cloud and DevOps
Hosting that stays up and bills that stay small.

Quality and Security
Find the bugs and the gaps before your users do.

Support and Maintenance
Someone looking after your software every month.
Insights
Further reading

Designing around WhatsApp
For many Indian businesses, WhatsApp is the main customer channel. How to automate invoices, reminders and updates without breaking the rules or annoying customers.

India's DPDP Act: a checklist for your app
The Digital Personal Data Protection Act's obligations are arriving in stages. A practical checklist for product teams: data inventory, notice, consent, rights, security and deletion.

Offline-first apps for patchy networks
On the shop floor, in the field or on the road, the signal comes and goes. How to design apps that keep working, never lose work and sync safely.
Common questions
Something else on your mind? Ask us directly.
We only have spreadsheets. Can we still have dashboards?
Yes. Many dashboards start from spreadsheets. We can connect them directly and later move the data into proper software as you grow.
Which tools do you use?
It depends on your needs: Looker Studio or Power BI for many businesses, or dashboards built into your own product when customers need to see them.
Can you forecast demand or cash flow?
Yes, once there is enough history. We start simple, measure accuracy and only add complexity when it improves the forecast.